Wednesday 29 April 2009

Delete rows from a DataTable

When I tried to delete DataRows from a DataTable based on some conditions, I wrote the code as below but receive an InvalidOperationException complaining {"Collection was modified; enumeration operation might not execute."}

DataColumn dc = dsData.Tables["tbl"].Columns["order_qty"];
foreach (DataRow dr in dsData.Tables["tbl"].Rows)
{
if (dr[dc].ToString() == "0")
dsData.Tables["tbl"].Rows.Remove(dr);
}

Then I changed my code to:

DataColumn dc = dsData.Tables["tbl"].Columns["order_qty"];
foreach (DataRow dr in dsData.Tables["tbl"].Rows)
{
if (dr[dc].ToString() == "0")
dr.Delete();
}

Everything works fine. Then I went to MSDN and found the explanation of difference between using Delete and Remove method on data table:

There are two methods you can use to delete a DataRow object from a DataTable object: the Remove method of the DataRowCollection object, and the Delete method of the DataRow object. While the Remove method deletes a DataRow from the DataRowCollection, the Delete method only marks the row for deletion. The actual removal occurs when the application calls the AcceptChanges method. By using Delete, you can programmatically check which rows are marked for deletion before actually removing them. When a row is marked for deletion, its RowState property is set to Deleted.

If a row is marked for deletion and you call the AcceptChanges method of the DataTable object, the row is removed from the DataTable. In contrast, if you call RejectChanges, the RowState of the row reverts to what it was before being marked as Deleted.

Obviously my first example won’t work because I used the Remove method which deletes a DataRow from the DataRowCollection within a foreach loop.

Friday 17 April 2009

How to Hide Rows from DataGridView in WinForm Application?

When you see the title, you may wonder why I am writing this, this is so obvious, we can easily achieve this by writing something like:

foreach (DataGridViewRow dgvr in MyDataGridView.Rows)
{
if (string.IsNullOrEmpty(dgvr.Cells["sales"].Value.ToString()))
{
dgvr.Visible = false;
}
}

However if you do this, you are more likely to get the error:
InvalidOperationException,
Row associated with the currency manager's position cannot be made invisible.

Why? Because you cannot make modifications to a row at runtime which is bound to a DataSource, unless you suspend the binding on all rows using CurrencyManager object like code shows below:

CurrencyManager cm = (CurrencyManager)BindingContext[dgvBulkSheetDtl.DataSource];
foreach (DataGridViewRow dgvr in MyDataGridView.Rows)
{
if (string.IsNullOrEmpty(dgvr.Cells["sales"].Value.ToString()))
{
cm.SuspendBinding();
dgvr.Visible = false;
}
}

Simple isn’t it? One thing you need to be aware is that if your DataGridView allows user to sort the columns, then you have to hide the rows again because the hidden rows will show up again. In this case, what you probably can do is to filter the data out from your data source.

Implement MSChart in a Windows Form Application

In my previous post, I have demonstrated step by step installing MSChart controls, a fantastic tool to generate amazing Charts in both Winform and ASP applications, on Visual Studio 2008. Now it’s time to show some working examples. Using MSChart to display a graph from Database data is very straight forward, the key is the syntax of binding data to a chart control. My demo is tested under Oracle 10 R2 and Visual Studio 2008.

First of all we need create a demo table, let’s say we want to compare the Actual Sales vs Forecast.

create table demo
(
sku number,
wcdate date,
actual number,
forecast number,
constraint pk01 primary key (sku, wcdate)
)
/
insert into demo values (24, to_date('08/03/2009', 'dd/mm/yyyy'), 3020, 3200);
insert into demo values (24, to_date('15/03/2009', 'dd/mm/yyyy'), 3131, 3200);
insert into demo values (24, to_date('22/03/2009', 'dd/mm/yyyy'), 2937, 2500);
insert into demo values (24, to_date('29/03/2009', 'dd/mm/yyyy'), 2842, 2500);
insert into demo values (24, to_date('05/04/2009', 'dd/mm/yyyy'), 2988, 2500);
/

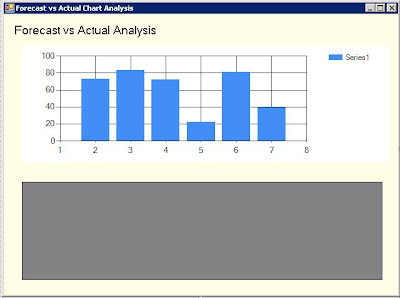
Secondly we create a new WinForm application in VS 2008, drag a Char control from tool box and place it at the top section of the form.

Next drag another DataGridView control and place it at the bottom of the form. We will then have something like the screenshot below.

Press F7 to go to the code view, we can then write some code to pull the data from database and bind the data to the chart control:

using System;
using System.Data;
using System.Windows.Forms;
using System.Data.OracleClient;

namespace ChartDemo
{
public partial class Form1 : Form
{
public Form1()
{
InitializeComponent();
}

DataSet dsdata = new DataSet();

// Populate public DataSet
private DataSet PopulateDataTable()
{
string connectionString = "Data Source=orcl;Persist Security Info=True; "
+ "User ID=scott;Password=xxxxx;Unicode=True";

string queryString = "select * from demo";

OracleConnection connection = new OracleConnection(connectionString);
OracleCommand command = new OracleCommand(queryString, connection);
OracleDataAdapter da = new OracleDataAdapter(command);

try
{
connection.Open();
if (!dsdata.Tables.Contains("chart"))
dsdata.Tables.Add("chart");
da.Fill(dsdata, "chart");
}
catch (OracleException oex)
{
throw new Exception(oex.Message);
}
finally
{
connection.Close();
}
return dsdata;
}

// Load the data to a DataGridView
private void LoadDGV()
{
dataGridView1.DataSource = PopulateDataTable();
dataGridView1.DataMember = "chart";
}

// Render the chart
private void LoadFcstVsActualChart()
{
DataView dv = new DataView(dsdata.Tables["chart"]);
chart1.Series["Actual"].Points.DataBindXY(dv, "wcdate", dv, "actual");
chart1.Series["Forecast"].Points.DataBindXY(dv, "wcdate", dv, "forecast");
}

//Form load event
private void Form1_Load(object sender, EventArgs e)
{
LoadDGV();
LoadFcstVsActualChart();
}
}
}

I believe above code is quite self-explanatory, firstly we created a DataSet and populate the data to the DataSet, then we binded the DataView to the Chart control, at the end we put all methods into Form load event to load data to DataDridView and generate the Chart afterwards. The import thing to remember is the syntax of binding data to a chart.

// Render the chart
private void LoadFcstVsActualChart()
{
DataView dv = new DataView(dsdata.Tables["chart"]);
chart1.Series["Actual"].Points.DataBindXY(dv, "wcdate", dv, "actual");
chart1.Series["Forecast"].Points.DataBindXY(dv, "wcdate", dv, "forecast");
}

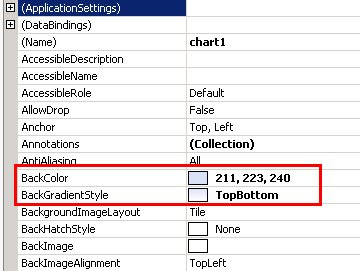
There are loads of different ways we can make our chart prettier to attract more eyeballs. For example you can change the background color or border style in the properties of the chart.

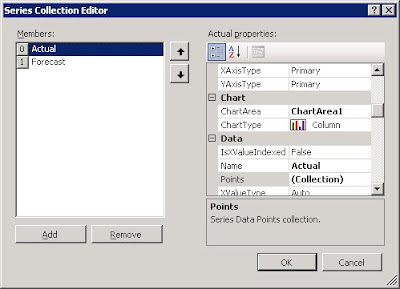
Or you can change the Chart Display type in Series collection. To see the best practice, please refer to Samples Environment for Microsoft Chart Controls from Microsoft

Now you can see how simple is that to use MSChart controls. A few lines of code can do the trick, I have tried MSChart in my last 2 projects, our customers who are so used to traditional dull business applications just love it. I hope you find it useful as well. Let me know if there is any problem or questions.

Friday 3 April 2009

Step by Step installing MS Chart Controls on Visual Studio 2008

Generating wonderful charts in .Net application sometimes can easily get customers blown away. Microsoft purchased some products from Dundas Company about a year and a half ago and implementing theirs charts technology into the products. And from last September they give us the free charting controls (both Web and WinForms) for use in our .NET 3.5 applications.

Step 1: To get start you need to download and install:
Microsoft Chart Controls for Microsoft .NET Framework 3.5 and Microsoft Chart Controls Add-on for Microsoft Visual Studio 2008.

Step 2: Once you have the installation files downloaded, install MSChart.exe first, as the add-on requires this to be installed. Both are quick installs, and should take no more than a few minutes, so when both have been successfully installed to your machine, you can start up Visual Studio.

Step 3: create a new Web or WinForm Application, and now to get the new control into our toolbox, we can right-click on a blank area of it and select Add Tab. Name it something like MSChart:


Step 4, right-click in the new tab and select Choose Items...


We should then see a dialog box like this:


Step 5: Click the Browse button and navigate to the Program Files\Microsoft Chart Controls\Assemblies folder. Here you want to add both the Windows.Form and the Web DLLs. Once they're added, they will be available to select in the list box:


So once they're added, and checked, they should be available in our toolbox:


After you’ve done the configuration, I strongly recommend you to download the Samples Environment for Microsoft Chart Controls from Microsoft and read the docs: Microsoft Chart Controls for .NET Framework Documentation.

In my next post, I will write a quick demo on how to implement MSChart in a Windows Form Application to display a graph from database data.